
Java 生成「多区域多指标对比分组柱状图(企业经营分析)」PDF 示例(MultipleBar)
MultipleBar2 页 A4 · 132 KB
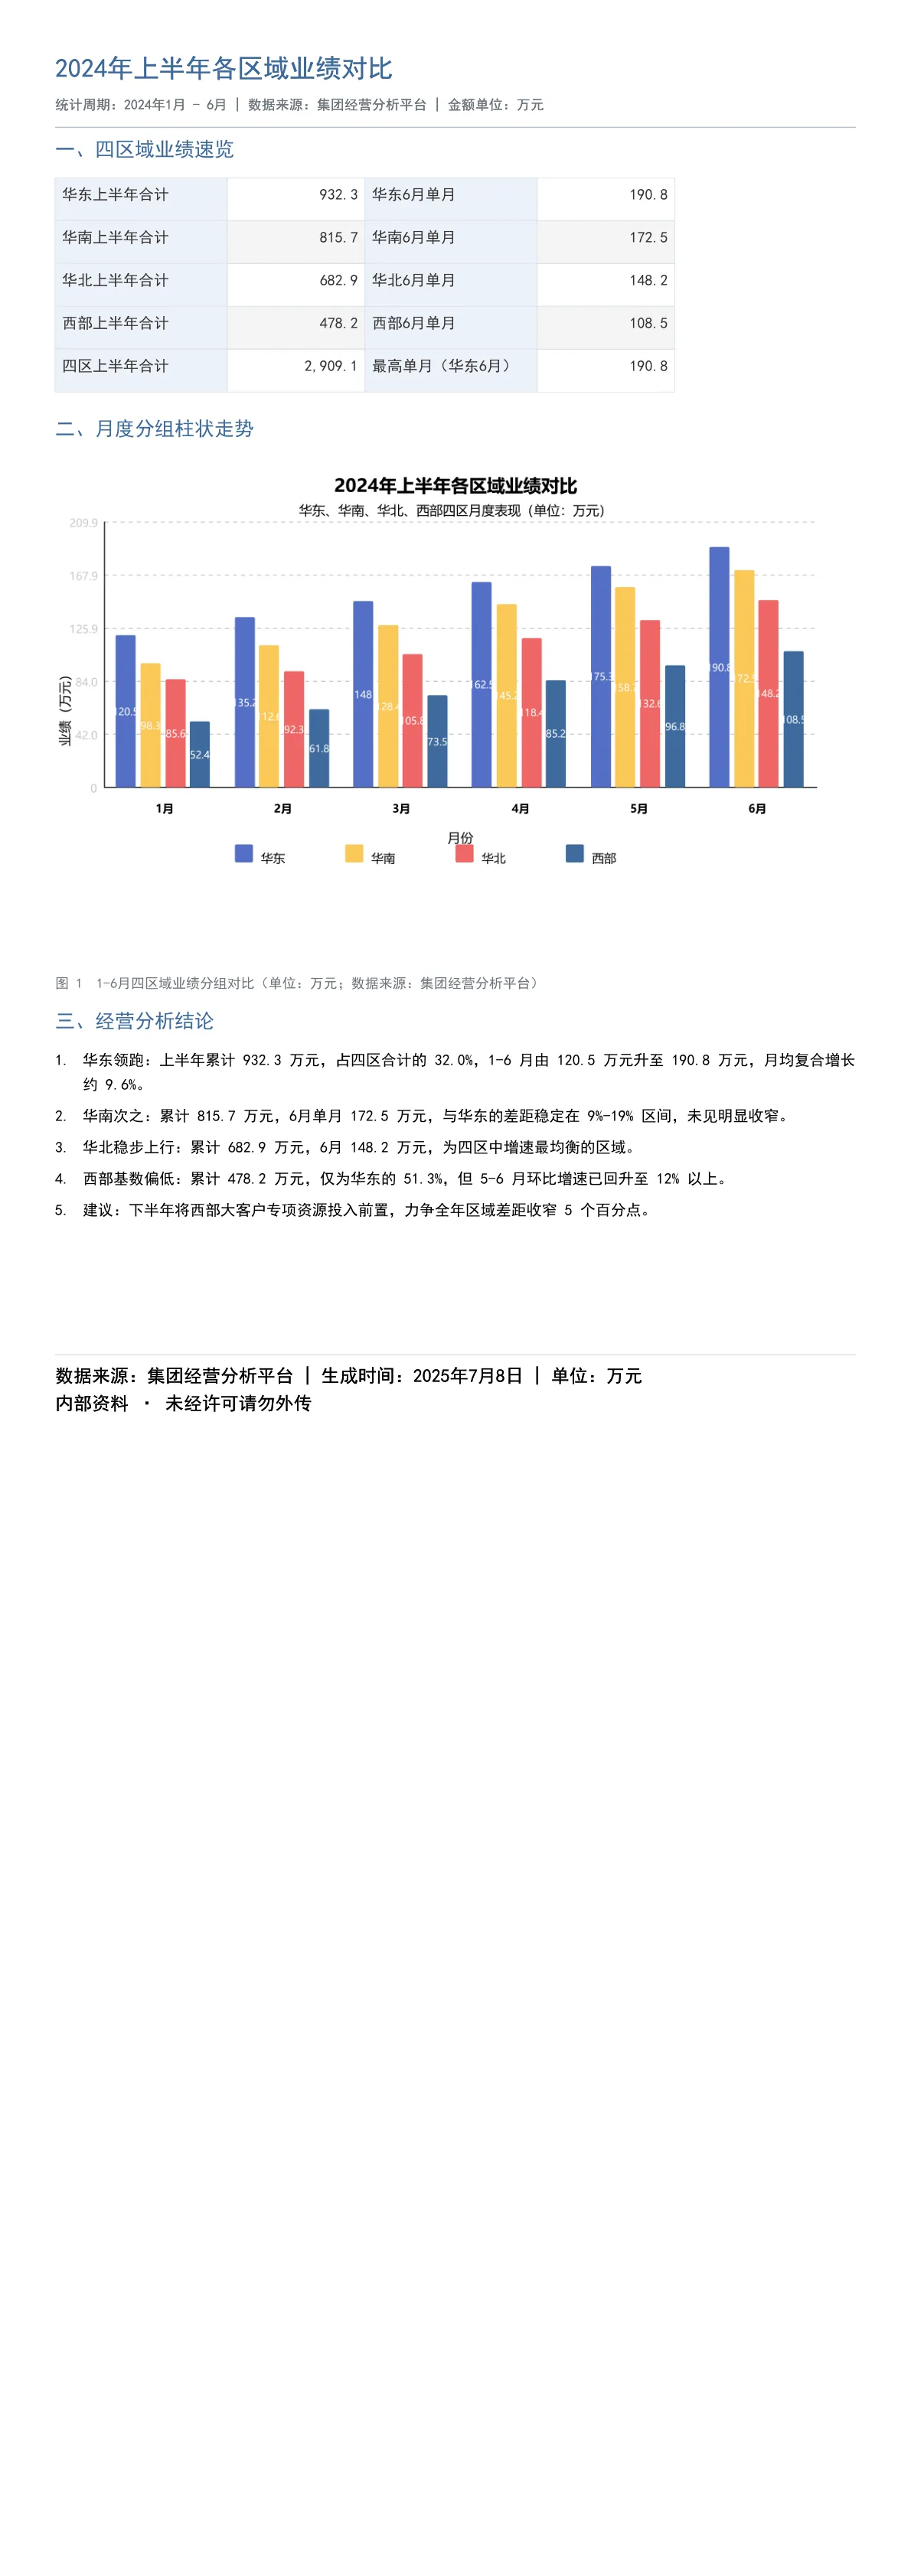
在同一坐标系下对比多个区域的多项经营指标,用分组柱状图呈现结构差异。
输出规格
- PDF 页数
- 2
- 图表类型
- MultipleBar
- 模板行数
- 69
- 源码行数
- 102
Java 源码 · JQuickBiz26MultiMetricBarTest.java
以下代码即生成上方 PDF 的完整测试类,可直接复制运行;Maven 依赖见快速开始章节。
/*
 * Licensed under the Apache License, Version 2.0 (the "License");
 * you may not use this file except in compliance with the License.
 * You may obtain a copy of the License at
 *
 *     http://www.apache.org/licenses/LICENSE-2.0
 *
 * Unless required by applicable law or agreed to in writing, software
 * distributed under the License is distributed on an "AS IS" BASIS,
 * WITHOUT WARRANTIES OR CONDITIONS OF ANY KIND, either express or implied.
 * See the License for the specific language governing permissions and
 * limitations under the License.
 *
 * Copyright (c) [2025-2099] Martin ([email protected])
 */
package com.github.paohaijiao.demo.biz;

import com.github.paohaijiao.JOption;
import com.github.paohaijiao.combol.JMultiBarChartData;
import com.github.paohaijiao.combol.JMultiBarChartRenderer;
import com.github.paohaijiao.config.JPdfConfig;
import com.github.paohaijiao.demo.constant.JQuickConstant;
import com.github.paohaijiao.enums.JChartType;
import com.github.paohaijiao.executor.JQuickPdfFactory;
import com.github.paohaijiao.factory.JChartRendererFactory;
import org.junit.Test;

import java.awt.Color;
import java.io.File;
import java.io.FileOutputStream;
import java.io.IOException;
import java.util.Arrays;

/**
 * 业务场景 Demo 26:多区域多指标对比分组柱状图(企业经营分析)
 *
 * <p>业务场景:企业运营部对比华东、华南、华北、西部四个区域 1-6 月的业绩完成情况,用于半年度经营分析会。</p>
 * <p>实际图表类型:{@link JChartType#MultipleBar} 分组柱状图,横轴为月份、每个月份并列四根区域柱。</p>
 *
 * <p>模板:{@code report/biz/26_multi_metric_bar.txt};图表以 SVG 文本形式绑定到模板的
 * {@code ${svg}} 占位符,输出到 {@code D:\test\biz\26_multi_metric_bar.pdf}。</p>
 *
 * <p>图表尺寸说明:图表按 700pt 宽的横版比例设计;模板中 {@code <svg>} 只声明宽度、不声明高度,
 * 宽度被页面自动收窄时高度会按原比例同步缩放,不会纵向拉伸变形。</p>
 *
 * @author Martin
 * @version 1.0.0
 */
public class JQuickBiz26MultiMetricBarTest {

    public static final String path = JQuickConstant.path;

    @Test
    public void biz26MultiMetricBar() throws IOException {
        JMultiBarChartData regionalData = new JMultiBarChartData();
        regionalData.setTitleText("2024年上半年各区域业绩对比");
        regionalData.setSubtitleText("华东、华南、华北、西部四区月度表现(单位:万元)");
        regionalData.setXAxisLabels(Arrays.asList("1月", "2月", "3月", "4月", "5月", "6月"));
        regionalData.setXAxisTitle("月份");
        regionalData.setYAxisTitle("业绩(万元)");
        // 华东区域
        JMultiBarChartData.BarData eastChina = new JMultiBarChartData.BarData();
        eastChina.setLegendText("华东");
        eastChina.setBarColor(JMultiBarChartRenderer.COLOR_A);
        eastChina.setValues(Arrays.asList(120.5, 135.2, 148.0, 162.5, 175.3, 190.8));
        // 华南区域
        JMultiBarChartData.BarData southChina = new JMultiBarChartData.BarData();
        southChina.setLegendText("华南");
        southChina.setBarColor(JMultiBarChartRenderer.COLOR_B);
        southChina.setValues(Arrays.asList(98.3, 112.6, 128.4, 145.2, 158.7, 172.5));
        // 华北区域
        JMultiBarChartData.BarData northChina = new JMultiBarChartData.BarData();
        northChina.setLegendText("华北");
        northChina.setBarColor(JMultiBarChartRenderer.COLOR_C);
        northChina.setValues(Arrays.asList(85.6, 92.3, 105.8, 118.4, 132.6, 148.2));
        // 西部区域
        JMultiBarChartData.BarData westChina = new JMultiBarChartData.BarData();
        westChina.setLegendText("西部");
        westChina.setBarColor(new Color(62, 107, 157));
        westChina.setValues(Arrays.asList(52.4, 61.8, 73.5, 85.2, 96.8, 108.5));
        regionalData.setBarDataList(Arrays.asList(eastChina, southChina, northChina, westChina));
        JOption option = new JOption();
        option.setData(regionalData);

        String svg = JChartRendererFactory.renderChart(JChartType.MultipleBar, option);

        File dir = new File(path + "biz");
        if (!dir.exists()) {
            dir.mkdirs();
        }
        FileOutputStream fileOutputStream = new FileOutputStream(path + "biz/26_multi_metric_bar.pdf");
        JPdfConfig config = new JPdfConfig();
        // 开启 flex 行布局,使模板中的 display:flex 生效(图表居中)
        config.getLayoutConfig().setFlexLayout(true);
        JQuickPdfFactory factory = new JQuickPdfFactory(config);
        factory.bind("svg", svg);
        byte[] bytes = factory.executeResource("report/biz/26_multi_metric_bar.txt");
        fileOutputStream.write(bytes);
        fileOutputStream.close();
    }
}
最小调用(3 行)
不想读完整测试类?核心就是这三行:绑定图表 SVG,执行模板,拿到 PDF 字节流。可直接复制到你的项目里。
// config 可省略;svg 来自 JChartRendererFactory.renderChart(...),见下方完整源码
factory.bind("svg", svg);
byte[] pdf = new JQuickPdfFactory(config).executeResource("report/biz/26_multi_metric_bar.txt");
模板文件 · 26_multi_metric_bar.txt
类 HTML + 内联 CSS 的模板语法,绑定数据后渲染为 PDF。下方为完整模板,可直接复制,也可下载原始文件。
<pdf>
<body>
  <div style="marginBottom:10px; borderBottom:1px solid #B9C2CC; paddingBottom:8px; keepTogether:true">
    <h1 style="color:#3E6B9D; fontSize:17; bold:true; marginBottom:3px">'2024年上半年各区域业绩对比'</h1>
    <p style="color:#6c757d; fontSize:9">'统计周期:2024年1月 - 6月 | 数据来源:集团经营分析平台 | 金额单位:万元'</p>
  </div>

  <div style="marginBottom:12px">
    <h2 style="color:#3E6B9D; fontSize:13; bold:true; borderBottom:1px solid #3E6B9D; paddingBottom:3px; marginBottom:8px">'一、四区域业绩速览'</h2>
    <table style="width:540px; fontSize:10">
      <tr>
        <td style="width:150px; backgroundColor:#EDF2F8; padding:6px; border:1px solid #DCE3EC">'华东上半年合计'</td>
        <td style="width:120px; padding:6px; textAlign:right; border:1px solid #DCE3EC">'932.3'</td>
        <td style="width:150px; backgroundColor:#EDF2F8; padding:6px; border:1px solid #DCE3EC">'华东6月单月'</td>
        <td style="width:120px; padding:6px; textAlign:right; border:1px solid #DCE3EC">'190.8'</td>
      </tr>
      <tr>
        <td style="width:150px; backgroundColor:#EDF2F8; padding:6px; border:1px solid #DCE3EC">'华南上半年合计'</td>
        <td style="width:120px; padding:6px; textAlign:right; border:1px solid #DCE3EC">'815.7'</td>
        <td style="width:150px; backgroundColor:#EDF2F8; padding:6px; border:1px solid #DCE3EC">'华南6月单月'</td>
        <td style="width:120px; padding:6px; textAlign:right; border:1px solid #DCE3EC">'172.5'</td>
      </tr>
      <tr>
        <td style="width:150px; backgroundColor:#EDF2F8; padding:6px; border:1px solid #DCE3EC">'华北上半年合计'</td>
        <td style="width:120px; padding:6px; textAlign:right; border:1px solid #DCE3EC">'682.9'</td>
        <td style="width:150px; backgroundColor:#EDF2F8; padding:6px; border:1px solid #DCE3EC">'华北6月单月'</td>
        <td style="width:120px; padding:6px; textAlign:right; border:1px solid #DCE3EC">'148.2'</td>
      </tr>
      <tr>
        <td style="width:150px; backgroundColor:#EDF2F8; padding:6px; border:1px solid #DCE3EC">'西部上半年合计'</td>
        <td style="width:120px; padding:6px; textAlign:right; border:1px solid #DCE3EC">'478.2'</td>
        <td style="width:150px; backgroundColor:#EDF2F8; padding:6px; border:1px solid #DCE3EC">'西部6月单月'</td>
        <td style="width:120px; padding:6px; textAlign:right; border:1px solid #DCE3EC">'108.5'</td>
      </tr>
      <tr>
        <td style="width:150px; backgroundColor:#EDF2F8; padding:6px; bold:true; border:1px solid #DCE3EC">'四区上半年合计'</td>
        <td style="width:120px; padding:6px; textAlign:right; bold:true; border:1px solid #DCE3EC">'2,909.1'</td>
        <td style="width:150px; backgroundColor:#EDF2F8; padding:6px; bold:true; border:1px solid #DCE3EC">'最高单月(华东6月)'</td>
        <td style="width:120px; padding:6px; textAlign:right; bold:true; border:1px solid #DCE3EC">'190.8'</td>
      </tr>
    </table>
  </div>

  <div style="marginBottom:12px">
    <h2 style="color:#3E6B9D; fontSize:13; bold:true; borderBottom:1px solid #3E6B9D; paddingBottom:3px; marginBottom:8px">'二、月度分组柱状走势'</h2>
    <div style="display:flex; justifyContent:center">
      <svg style="width:700pt">${svg}</svg>
    </div>
    <p style="fontSize:9; color:#6c757d; italic:true; marginTop:6px">'图 1  1-6月四区域业绩分组对比(单位:万元;数据来源:集团经营分析平台)'</p>
  </div>

  <div style="marginBottom:10px">
    <h2 style="color:#3E6B9D; fontSize:13; bold:true; borderBottom:1px solid #3E6B9D; paddingBottom:3px; marginBottom:8px">'三、经营分析结论'</h2>
    <list style="paddingLeft:18px; fontSize:10" listType="ordered">
      <li style="marginBottom:6px">'华东领跑:上半年累计 932.3 万元,占四区合计的 32.0%,1-6 月由 120.5 万元升至 190.8 万元,月均复合增长约 9.6%。'</li>
      <li style="marginBottom:6px">'华南次之:累计 815.7 万元,6月单月 172.5 万元,与华东的差距稳定在 9%-19% 区间,未见明显收窄。'</li>
      <li style="marginBottom:6px">'华北稳步上行:累计 682.9 万元,6月 148.2 万元,为四区中增速最均衡的区域。'</li>
      <li style="marginBottom:6px">'西部基数偏低:累计 478.2 万元,仅为华东的 51.3%,但 5-6 月环比增速已回升至 12% 以上。'</li>
      <li style="marginBottom:6px">'建议:下半年将西部大客户专项资源投入前置,力争全年区域差距收窄 5 个百分点。'</li>
    </list>
  </div>

  <div style="textAlignment:center; marginTop:10px; paddingTop:10px; borderTop:1px solid #dee2e6; color:#6c757d; fontSize:8">
    <p>'数据来源:集团经营分析平台 | 生成时间:2025年7月8日 | 单位:万元'</p>
    <p>'内部资料 · 未经许可请勿外传'</p>
  </div>
</body>
</pdf>
同分组示例
本页 PDF、预览图、模板与源码均由 JQuick-Pdf 真实运行产出,可自由复制到你的项目中使用。