
Critical-dimension boxplot by production line (quality control) — generate this PDF with Java (BOXPLOT)
BOXPLOT1 页 A4 · 136 KB
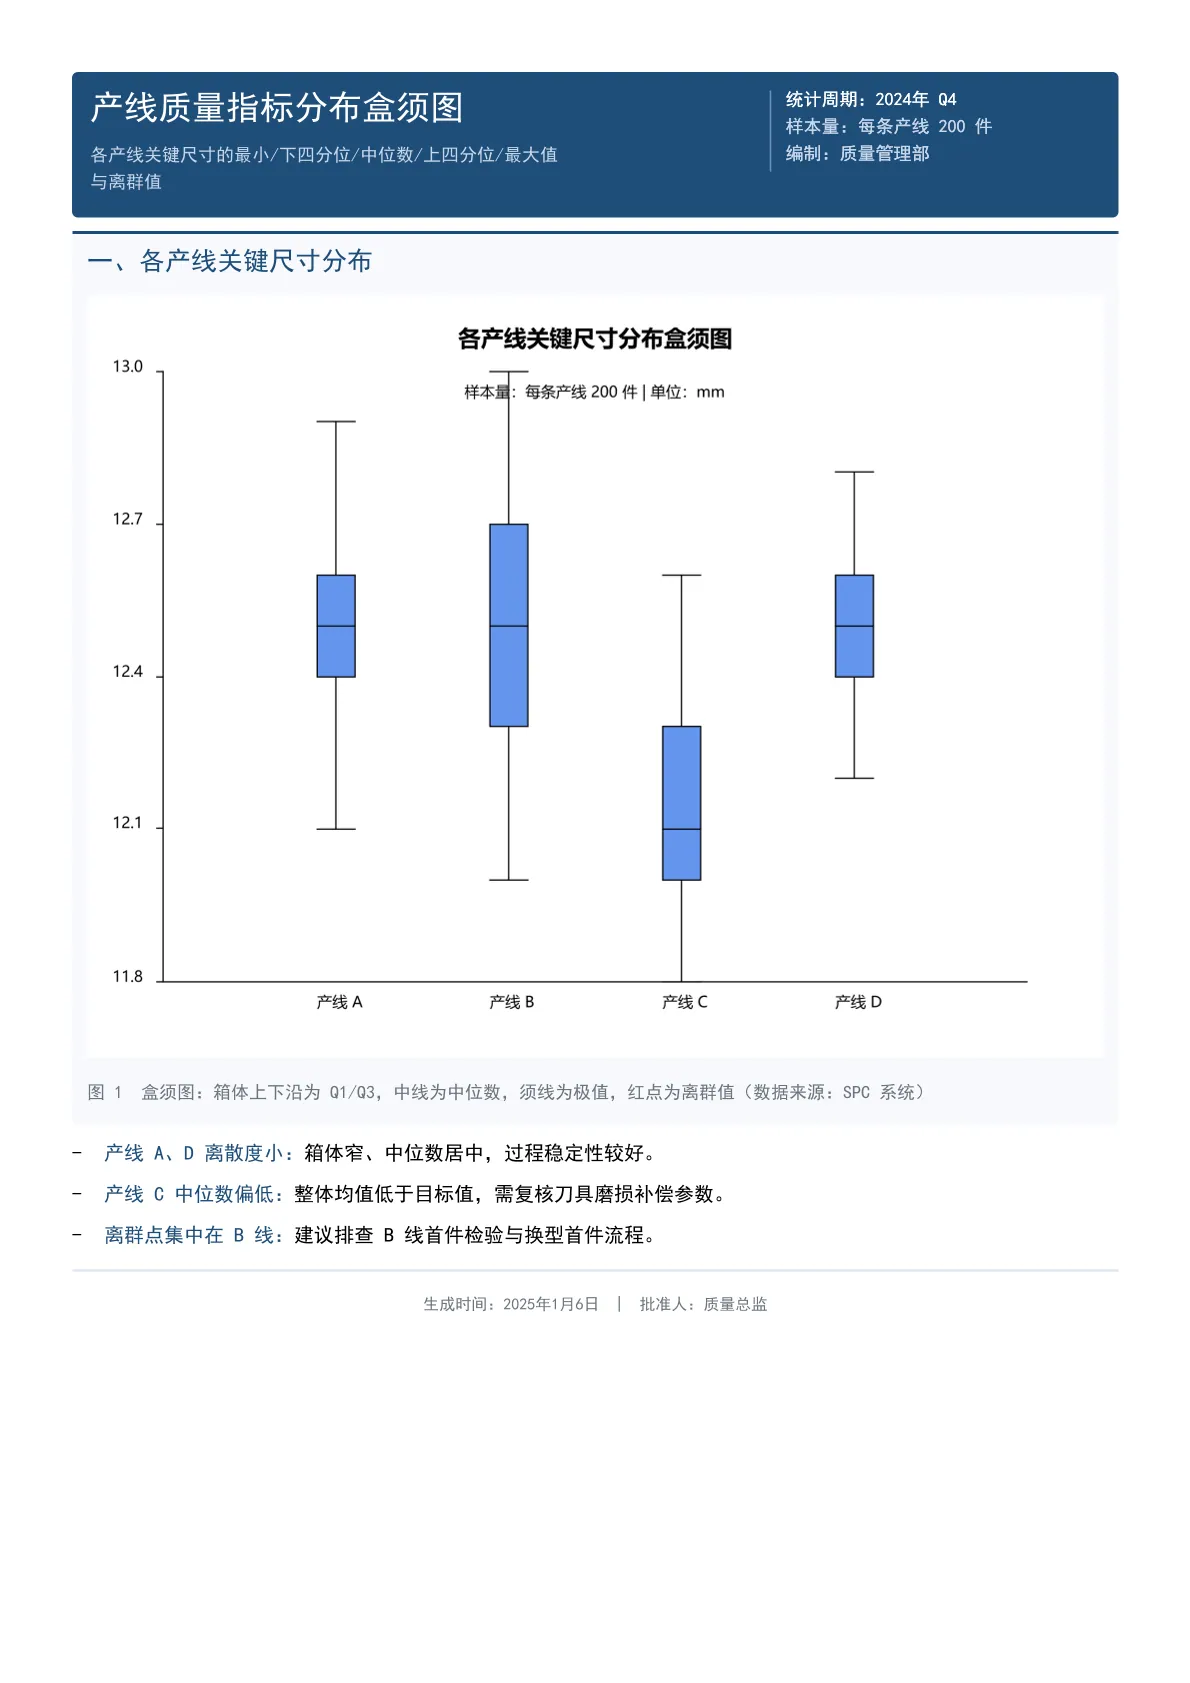
SPC statistics of key dimensions across four production lines: the boxplot shows the minimum, Q1, median, Q3, maximum and outliers of each line, with sample-size and unit subtitles and stability conclusions plus first-article inspection advice below.
Output specs
- PDF pages
- 1
- Chart type
- BOXPLOT
- Template lines
- 36
- Source lines
- 92
Java source · JQuickBiz56BoxChartTest.java
This is the complete test class that produced the PDF above — copy it and run as-is; see the quick-start section for the Maven dependency.
/*
 * Licensed under the Apache License, Version 2.0 (the "License");
 * you may not use this file except in compliance with the License.
 * You may obtain a copy of the License at
 *
 *     http://www.apache.org/licenses/LICENSE-2.0
 *
 * Unless required by applicable law or agreed to in writing, software
 * distributed under the License is distributed on an "AS IS" BASIS,
 * WITHOUT WARRANTIES OR CONDITIONS OF ANY KIND, either express or implied.
 * See the License for the specific language governing permissions and
 * limitations under the License.
 *
 * Copyright (c) [2025-2099] Martin ([email protected])
 */
package com.github.paohaijiao.demo.biz;

import com.github.paohaijiao.JOption;
import com.github.paohaijiao.axis.JCategoryAxis;
import com.github.paohaijiao.config.JPdfConfig;
import com.github.paohaijiao.demo.constant.JQuickConstant;
import com.github.paohaijiao.enums.JChartType;
import com.github.paohaijiao.executor.JQuickPdfFactory;
import com.github.paohaijiao.factory.JChartRendererFactory;
import com.github.paohaijiao.series.JBoxplot;
import org.junit.Test;

import java.io.File;
import java.io.FileOutputStream;
import java.io.IOException;
import java.util.ArrayList;
import java.util.List;

/**
 * 业务场景 Demo 56:产线质量指标分布盒须图(质量管理)
 *
 * <p>业务场景:质量管理部门对多条产线的关键尺寸进行统计过程控制(SPC),
 * 用盒须图(箱线图)展示各产线数据的最小值、下四分位数(Q1)、中位数、
 * 上四分位数(Q3)、最大值以及离群值,用于评估过程稳定性。</p>
 * <p>实际图表类型:{@link JChartType#BOXPLOT} 盒须图。</p>
 *
 * <p>模板:{@code report/biz/56_boxchart.txt};图表以 SVG 文本形式绑定到模板的
 * {@code ${svg}} 占位符,输出到 {@code D:\test\biz\56_boxchart.pdf}。</p>
 *
 * <p>图表尺寸说明:图表按 700pt × 380pt 的横版比例设计;模板中 {@code <svg>}
 * 只声明宽度、不声明高度,宽度被页面自动收窄时高度会按原比例同步缩放。</p>
 *
 * @author Martin
 * @version 1.0.0
 */
public class JQuickBiz56BoxChartTest {

    public static final String path = JQuickConstant.path;

    @Test
    public void biz56BoxChart() throws IOException {
        // 四条产线的关键尺寸样本统计:[min, Q1, median, Q3, max]
        // 产线 A:稳定
        // 产线 B:含离群值(追加第 6 个值为离群点)
        // 产线 C:中位数偏低
        // 产线 D:稳定
        List<Object[]> boxData = new ArrayList<>();
        boxData.add(new Object[]{12.1, 12.4, 12.5, 12.6, 12.9});
        boxData.add(new Object[]{12.0, 12.3, 12.5, 12.7, 13.0, 13.6});
        boxData.add(new Object[]{11.8, 12.0, 12.1, 12.3, 12.6});
        boxData.add(new Object[]{12.2, 12.4, 12.5, 12.6, 12.8});

        JBoxplot boxplot = new JBoxplot("产线关键尺寸分布");
        boxplot.setData(boxData);

        JOption option = new JOption();
        option.title("各产线关键尺寸分布盒须图", "样本量:每条产线 200 件 | 单位:mm");
        option.xAxis(new JCategoryAxis().data("产线 A", "产线 B", "产线 C", "产线 D"));
        option.series(boxplot);

        String svg = JChartRendererFactory.renderChart(JChartType.BOXPLOT, option);

        File dir = new File(path + "biz");
        if (!dir.exists()) {
            dir.mkdirs();
        }
        FileOutputStream fileOutputStream = new FileOutputStream(path + "biz/56_boxchart.pdf");
        JPdfConfig config = new JPdfConfig();
        config.getLayoutConfig().setFlexLayout(true);
        JQuickPdfFactory factory = new JQuickPdfFactory(config);
        factory.bind("svg", svg);
        byte[] bytes = factory.executeResource("report/biz/56_boxchart.txt");
        fileOutputStream.write(bytes);
        fileOutputStream.close();
    }
}
Minimal invocation (3 lines)
Skip the full test class — the core is these three lines: bind the chart SVG, execute the template, get the PDF bytes. Copy them straight into your project.
// config 可省略;svg 来自 JChartRendererFactory.renderChart(...),见下方完整源码
factory.bind("svg", svg);
byte[] pdf = new JQuickPdfFactory(config).executeResource("report/biz/56_boxchart.txt");
Template file · 56_boxchart.txt
An HTML-like template with inline CSS that renders to PDF once bound to data. The full template is below — copy it or download the raw file.
<pdf>
<body>
  // 56 盒须图(箱线图)Demo:用于展示多组数据的分布、四分位数与离群值
  <div style="background:#1F4E79; padding:12px; borderRadius:4px; marginBottom:10px; keepTogether:true">
    <div style="display:flex; justifyContent:space-between">
      <div style="width:320px">
        <h1 style="color:white; fontSize:17; bold:true; marginBottom:3px">'产线质量指标分布盒须图'</h1>
        <p style="color:#C7D6EA; fontSize:9">'各产线关键尺寸的最小/下四分位/中位数/上四分位/最大值与离群值'</p>
      </div>
      <div style="width:220px; textAlignment:right; borderLeft:1px solid #6E8FBF; paddingLeft:10px">
        <p style="color:white; fontSize:9">'统计周期:2024年 Q4'</p>
        <p style="color:#C7D6EA; fontSize:9">'样本量:每条产线 200 件'</p>
        <p style="color:#C7D6EA; fontSize:9">'编制:质量管理部'</p>
      </div>
    </div>
  </div>

  <div style="marginBottom:10px; padding:10px; backgroundColor:#F7F9FC; borderRadius:4px; borderTop:2px solid #1F4E79">
    <h2 style="color:#1F4E79; marginBottom:6px; fontSize:13; bold:true">'一、各产线关键尺寸分布'</h2>
    <div style="display:flex; justifyContent:center">
      <svg style="width:700pt">${svg}</svg>
    </div>
    <p style="fontSize:9; color:#6c757d; italic:true; marginTop:6px">'图 1  盒须图:箱体上下沿为 Q1/Q3,中线为中位数,须线为极值,红点为离群值(数据来源:SPC 系统)'</p>
  </div>

  <list style="listStyleType:disc; paddingLeft:16px; fontSize:10">
    <li style="marginBottom:6px"><span style="bold:true; color:#1F4E79">'产线 A、D 离散度小:'</span>'箱体窄、中位数居中,过程稳定性较好。'</li>
    <li style="marginBottom:6px"><span style="bold:true; color:#1F4E79">'产线 C 中位数偏低:'</span>'整体均值低于目标值,需复核刀具磨损补偿参数。'</li>
    <li style="marginBottom:6px"><span style="bold:true; color:#1F4E79">'离群点集中在 B 线:'</span>'建议排查 B 线首件检验与换型首件流程。'</li>
  </list>

  <lineSeparator style="strokeColor:#DCE3EC"></lineSeparator>
  <p style="color:#6c757d; fontSize:8; textAlignment:center; marginTop:6px">'生成时间:2025年1月6日 | 批准人:质量总监'</p>
</body>
</pdf>
More demos in this group
The PDF, preview image, template and source code on this page were all produced by a real JQuick-Pdf run and are free to copy into your own project.