
Monthly revenue report (enterprise operations)
LINEAn operations system aggregates monthly revenue and net profit and plots both series across twelve months for the management review meeting.
Pure Java · Apache-2.0 · Zero browser dependency
Generate chart-rich PDF reports in pure Javano browser, no hand-written chart drawing code
One HTML/CSS-style template plus one ECharts-style chart config, a single data binding, and you get a byte[] back — layout, vector charts and automatic pagination all happen inside one JVM process.
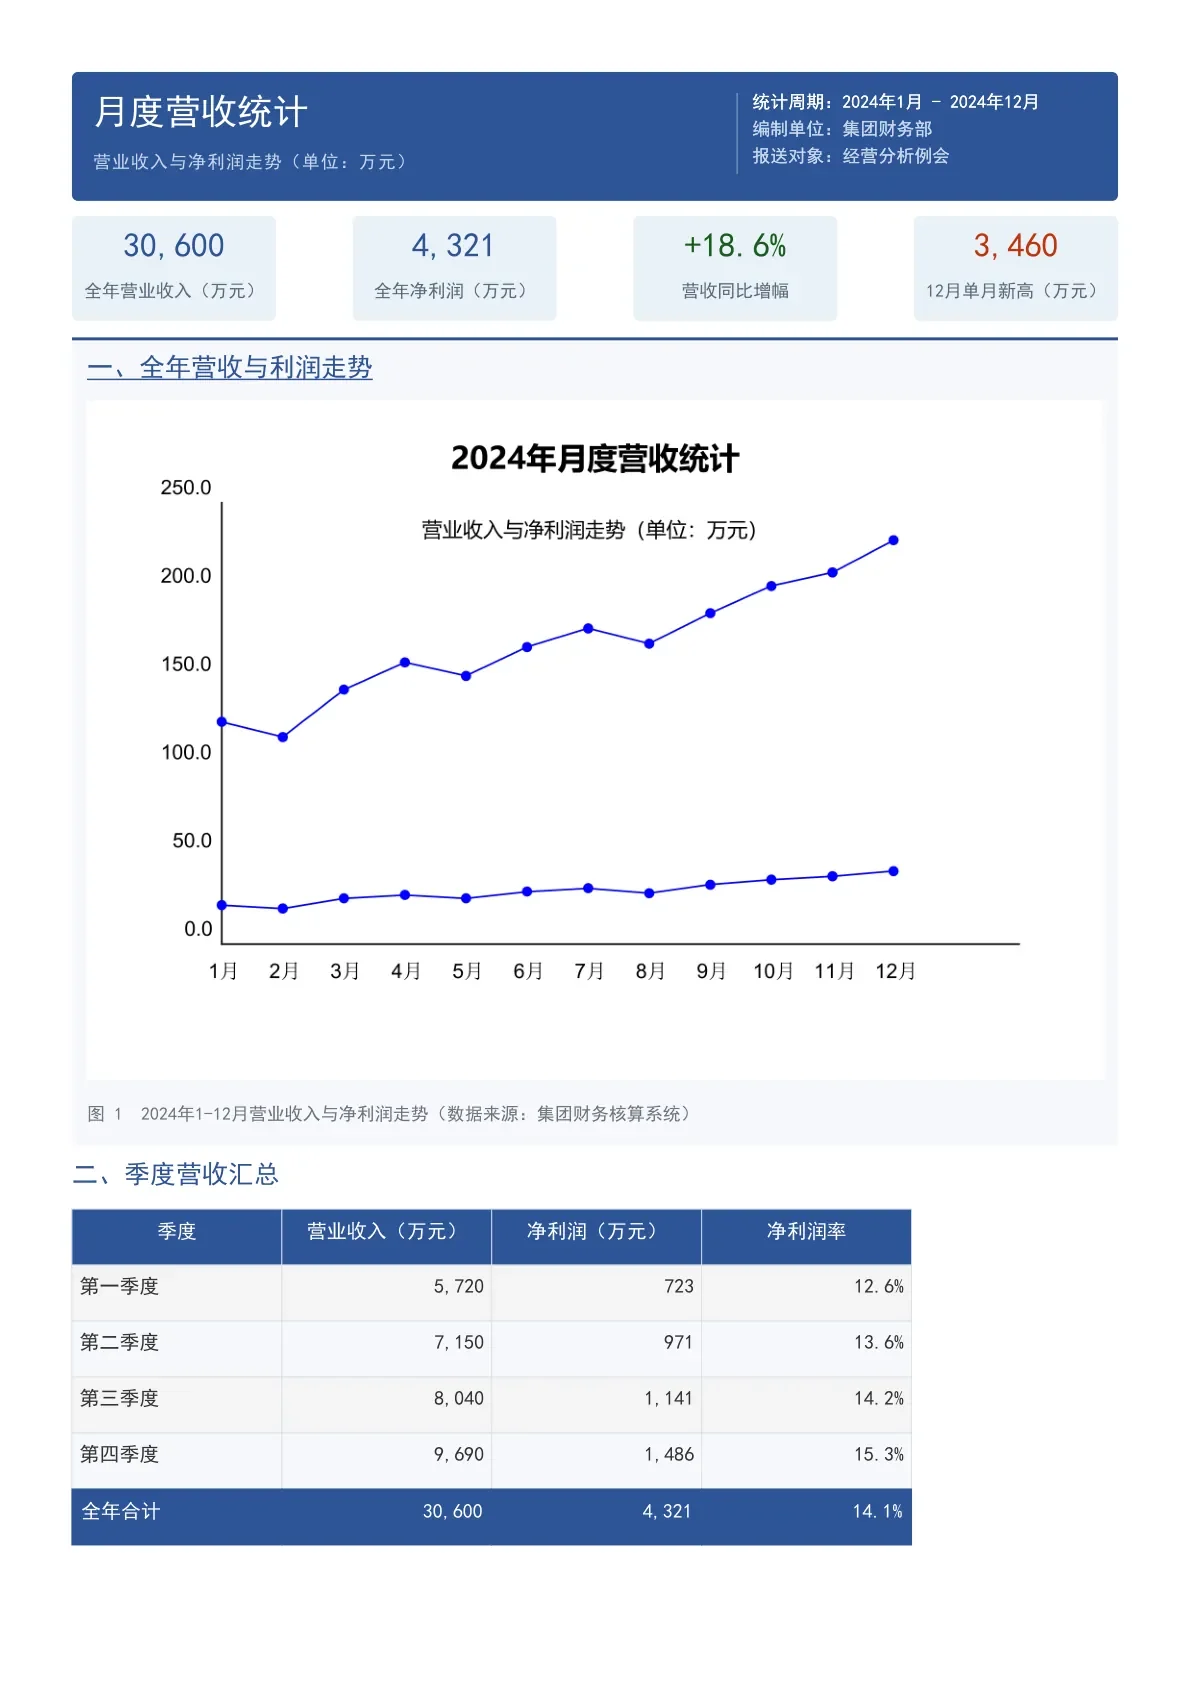
Not a design mock-up: generated by the sample code — download the PDF and the template source to verify
JOption option = new JOption();option.title().text("2024年月度营收统计");JCategoryAxis x = new JCategoryAxis();x.data("1月", "2月", "3月", "4月", "5月", "6月");option.xAxis(x); option.yAxis(new JValueAxis());option.series(new JLine().name("营业收入").data(1860, 1720, 2140));String svg = JChartRendererFactory.renderChart(JChartType.LINE, option);byte[] pdf = JQuickPdfFactory.create().bind("svg", svg) .executeResource("report/monthly.txt"); // template: <svg>${svg}</svg>Files.write(Paths.get("monthly.pdf"), pdf);Imports and the main method omitted; the chart takes one line in the template, <svg>${svg}</svg>, configured ECharts-style via JOption.
This comparison is not a knock on iText — it is a great library. But when what you want is "write reports like web pages, charts out of the box", the two differ by an order of magnitude in effort.
| Concern | JQuick-Pdf | iText 7 |
|---|---|---|
| Getting started | HTML/CSS-style template + data binding — a frontend mindset | Build document objects element by element in Java |
| Charts | 30+ built-in vector charts, configured ECharts-style via JOption | No built-in chart engine; bring JFreeChart or similar, rasterize, then insert |
| Chinese text | Bundled CJK fonts, zero configuration | Find and register font files yourself |
| Runtime | One JVM — no browser, no native libraries | Pure Java works (chart pipeline needs extra deps) |
| License | Apache-2.0 (4.0.0+) | AGPL-3.0 community edition; commercial use requires a paid license |
9 lines of core code vs three stages of glue code — the gap is exactly the part where the chart enters the document.
JQuick-Pdf is the PDF toolkit of the JQuick ecosystem. It focuses on generating, rendering and exporting PDFs from Java: write a template that looks like HTML with inline CSS, bind your data and get a PDF back — as a byte[], a stream or a file.
Templates are parsed with a self-developed grammar and drawn page by page through Apache PDFBox. The whole pipeline has no browser, no headless Chrome and no native library, which makes it a good fit for services, scheduled jobs and desktop applications.
| Module | Coordinate | Purpose |
|---|---|---|
jquick-pdfx |
io.github.paohaijiao:jquick-pdfx |
Parser, renderer, layout engine and the JQuickPdfFactory entry point — enough for most projects |
jquick-pdf-css |
io.github.paohaijiao:jquick-pdf-css |
CSS model: style properties, units and colours |
jquick-pdf-svg |
io.github.paohaijiao:jquick-pdf-svg |
SVG / ECharts-style chart generation (30+ chart types) |
jquick-pdf-data |
io.github.paohaijiao:jquick-pdf-data |
Chart configuration model (JOption, JChart, JTitle, JLegend, …) |
jquick-pdf-font |
io.github.paohaijiao:jquick-pdf-font |
Bundled CJK fonts, so Chinese text needs no extra configuration |
style="..." attributes.minHeight (camelCase) and min-height (standard CSS) are interchangeable and can be mixed in one declaration.${variable} binds plain values while &{resource} references registered resources such as charts, sub-templates and trees.<dependency> <groupId>io.github.paohaijiao</groupId> <artifactId>jquick-pdfx</artifactId> <version>4.1.0</version></dependency>implementation 'io.github.paohaijiao:jquick-pdfx:4.1.0'Chart support is an optional dependency:
<dependency> <groupId>io.github.paohaijiao</groupId> <artifactId>jquick-pdf-svg</artifactId> <version>4.1.0</version></dependency>implementation 'io.github.paohaijiao:jquick-pdf-svg:4.1.0'import com.github.paohaijiao.executor.JQuickPdfFactory;
import java.nio.file.Files;import java.nio.file.Paths;
public class HelloDemo {
public static void main(String[] args) throws Exception { String template = "" + "<pdf>" + " <body>" + " <h1 style=\"fontSize:24;fontColor:blue\">'Hello jquick-pdf'</h1>" + " <p>'Customer: '${customer}</p>" + " </body>" + "</pdf>";
byte[] pdf = JQuickPdfFactory.create() .bind("customer", "Martin") .executeContent(template);
Files.write(Paths.get("hello.pdf"), pdf); }}All three methods return a byte[]:
| Method | Template source |
|---|---|
executeContent(String) |
Template text held in memory |
executeResource(String) |
A classpath resource, for example "report.txt" |
executeFile(String) |
A file on disk, for example "D:/templates/report.txt" |
The JQuick-Pdf template grammar defines 18 element types. Their names and support status:
| Element | Description | Support status |
|---|---|---|
paragraph |
Paragraph container (written as <p> in templates) holding a run of text with inline styles |
Supported |
heading |
Heading element, corresponding to the six levels <h1> … <h6> |
Supported |
list |
List container; works with <li> to render ordered or unordered items |
Supported |
table |
Table; works with <tr> / <th> / <td> to draw rows, columns and cell styles |
Supported |
image |
Raster image; the source is specified with src |
Supported |
svg |
Vector graphics; embed charts with ${svg} / &{svg} |
Supported |
div |
Block container with background, border, padding, size, rotation and flex layout support | Supported |
span |
Inline container for styling a fragment of text inside a paragraph | Supported |
areaBreak |
Forced page break; content after it is drawn on the next page | Supported |
button |
Button control for building interactive PDF forms | Supported |
checkbox |
Checkbox control for building interactive PDF forms | Supported |
comboBoxField |
Combo-box (drop-down) control for building interactive PDF forms | Supported |
htmlPageBreak |
HTML-style page break at the declared position | Supported |
lineSeparator |
Horizontal separator line | Supported |
tab |
Tab character for tab-stop aligned layout | Supported |
textArea |
Multi-line text-area control for building interactive PDF forms | Supported |
tree |
Tree structure for rendering hierarchical data | Supported |
value |
Text value node: literal text wrapped in single quotes, or a value bound with ${...} |
Supported |
Minimal template snippets for each element (the <pdf><body> root is omitted for brevity).
A paragraph uses <p> and is the block element for ordinary text:
<p style="fontSize:12; lineHeight:1.5">'A paragraph that holds a run of ordinary text.'</p>Headings use <h1> … <h6>; the smaller the number, the higher the level:
<h1 style="fontSize:20; fontColor:#1f2937">'Level-one heading'</h1><h2 style="fontSize:16; fontColor:#374151">'Level-two heading'</h2>A list uses <list> + <li>, with list-style-type controlling the bullet:
<list style="list-style-type:disc; fontSize:12"> <li>'First unordered item'</li> <li>'Second unordered item'</li></list>Tables follow the <table> → <tr> → <th> / <td> hierarchy:
<table style="width:100%; fontSize:11"> <tr> <th style="backgroundColor:#f8f9fa; padding:5px">'Name'</th> <th style="backgroundColor:#f8f9fa; padding:5px">'Age'</th> </tr> <tr> <td style="padding:5px">'Alice'</td> <td style="padding:5px">'28'</td> </tr></table>An image uses <image>; the source comes from src, and width/height are optional:
<image src="logo.png" style="width:120px; height:60px" />Vector graphics use <svg>, usually bound to a rendered chart string with ${svg}:
<svg style="width:400px; height:300px">${svg}</svg><div> is a block container used to group content and style it together (background, border, padding, flex layout, …):
<div style="padding:10px; backgroundColor:#f8f9fa; borderRadius:4px"> <p style="fontSize:12">'A paragraph inside the container.'</p></div><span> is an inline container for styling a fragment of text inside a paragraph:
<p style="fontSize:12">'Total: '<span style="fontColor:red; fontWeight:bold">'$99.00'</span></p><areaBreak> forces a page break; content after it starts on the next page:
<p>'Content on page one'</p><areaBreak /><p>'Content on page two'</p><button> renders an interactive button form field; name identifies the field:
<button name="confirm" style="width:80px; height:28px">'Submit'</button><checkbox> renders a checkbox form field:
<checkbox name="agreed" />'I have read and agree to the terms'<comboBoxField> renders a drop-down form field; name identifies the field:
<comboBoxField name="city" style="width:200px; height:24px" /><htmlPageBreak> inserts an HTML-style page break at its declared position:
<p>'Content before the break'</p><htmlPageBreak /><p>'Content after the break'</p><lineSeparator> draws a horizontal separator line:
<lineSeparator style="width:100%; color:#cccccc" /><tab> inserts a tab character for tab-stop aligned layout:
<p style="fontSize:12">'Name: '<tab />'Alice'</p><textArea> renders a multi-line text-area form field:
<textArea name="remark" style="width:300px; height:80px" /><tree> renders a tree structure; the tree data is passed in via a bound variable:
<tree style="width:100%; fontSize:12">${deptTree}</tree>value is the grammar-level text node: single-quoted literal text and ${...} bindings both render as the final text:
<p>'Customer: '${customer}</p>Styles are declared in the element’s style="..." attribute; standard CSS kebab-case names (font-size) and camelCase names (fontSize) are equivalent and can be mixed. Size units accept px, pt, mm, cm and in. Commonly used properties:
| Property | Description | Applies to |
|---|---|---|
width |
Element width | Block elements such as div, table, image |
height |
Element height | Block elements such as div, table, image |
margin |
Outer margin — the space between the element and its neighbours | All elements |
padding |
Inner padding — the space between content and border | Container elements such as div, table, td, list |
border |
Border with width, line style and colour, e.g. 1px solid #cccccc |
div, table, td, … |
background-color |
Background colour; accepts colour names, #RRGGBB, rgb() / rgba() |
Container elements such as div, table, td, list |
color |
Text (foreground) colour | Text-bearing elements: paragraph, value, table cells |
font-size |
Font size | Text-bearing elements |
font-family |
Font family; the bundled CJK fonts render Chinese out of the box | Text-bearing elements |
text-align |
Horizontal alignment: left / center / right |
paragraph, value, td, div |
vertical-align |
Vertical alignment: top / middle / bottom |
Table cells such as td and container elements |
line-height |
Line height (leading) | Text elements such as paragraph, value |
font-weight |
Font weight, e.g. normal / bold |
Text-bearing elements |
The 209 demos below cover every vector chart type, the common document layouts and the multilingual rendering of JQuick-Pdf, all produced by real runs of the sample code: download the PDF, check the rendered preview and compare the Java source per group.
Biz DemoScenario DemosFinance & Tax DemosCustoms & Trade DemosBanking DemosGovernment DemosMedical DemosSupply-chain DemosCreditReport DemoI18n Demo
40 enterprise and government reports and documents covering line, bar, pie, radar, funnel, Gantt, heatmap, tree and map charts, plus layout-only templates such as warehouse receipts, resumes, inspection reports, settlement statements, invitation letters, tenders, receipts and archive covers.
53 demos
An operations system aggregates monthly revenue and net profit and plots both series across twelve months for the management review meeting.
Counts the applications received and approved per month and compares approval throughput with a bar chart to spot backlog months.
Maps business volume onto a geographic chart so regional density differences become immediately visible.
Buckets loans by overdue age and shows the share of each bucket in a pie chart to expose asset quality and risk concentration.
Counts enterprises per credit grade from AAA down to D and shows the rating structure as a donut chart.
Tracks the average handling duration and the number of overdue tickets per month with multiple line series.
A gauge shows the current CPU and memory utilisation so on-duty engineers can read the state at a glance.
Scores enterprise customers on solvency, profitability and operational stability and renders the risk profile as a radar chart.
Compares budget execution per department with horizontal bars to pinpoint departments that lag behind.
Counts impressions, sign-ups, real-name verifications and completed transactions layer by layer to find the weakest step of the funnel.
Compares several operating metrics across multiple regions in one coordinate system with grouped bars.
Builds a month-by-metric matrix and uses heatmap intensity to surface unusual combinations quickly.
A relation graph shows how cost items belong to and flow between the group and its departments.
Projects warning events by occurrence time and impact level as a scatter plot to reveal event density and peak windows.
Compares planned and actual quarterly values and uses an area chart to show the cumulative completion gap.
Counts merchants by industry and renders the two-level industry and sub-industry structure as a sunburst chart.
Combines contract count and contract value in one line-bar chart to highlight where volume and amount diverge.
A tree chart shows how funds are pooled from and allocated back to the group member companies.
Buckets transactions by handling duration and uses a bar chart to find the most time-consuming service types.
Compares on-duty rates across departments with multiple horizontal bar series.
Aggregates alerts by week and lays them out on a timeline to show peaks and the response rhythm.
Counts projects and investment per status — under construction, completed, suspended — and shows the area share with a treemap.
Overlays this period and last period KPIs on one radar chart so rises and falls of each metric are directly comparable.
Groups customers by value tier and shows the concentration of high-value customers in a pie chart.
Measures the conversion rate from visit to completion for online transactions and quantifies the effect of the digital service rollout.
Bars carry output value while lines carry growth rate, presenting volume and growth together in a single chart.
Counts incidents per administrative region and highlights the clusters on a command-centre map.
Tracks daily call volume per interface with multiple line series to compare traffic across services.
A gauge relates the current error rate to the SLA threshold so breaches are obvious at first sight.
Places existing business on balance, yield and customer count axes and tiers them with a bubble chart.
Shows planned and actual durations of each phase in a Gantt chart to identify delayed milestones.
Carries no business meaning: it demonstrates template elements and style attributes so they can be copied when writing templates.
The triplicate form filled in when a material reserve company receives goods: a four-column block for supplier and purchase contract details, an eight-column item table, a large total-amount row and four signature slots for the keeper, inspector, warehouse manager and finance reviewer.
Lays a candidate profile out as a ready-to-send one-page resume: a dark left column carries the name, contact details, core skills and certificates, while the right column expands into summary, work history, projects and education with a timeline for each role.
A commissioned inspection report issued by a testing lab: sample details plus a five-column table of test items with required limits and measured results, a grouped bar chart comparing limits against measurements, a large green verdict block and a three-column signature area.
The document the two parties of an engineering project use to settle payments per delivery period: side-by-side party boxes, a five-column cost breakdown with the total in a highlighted last row, amount in words and figures, the payee account and a seal box on the right.
An invitation from an industry association to its member companies: centred title and salutation, indented body paragraphs, a three-column agenda, three attendee info boxes, a right-aligned sign-off and contact details in the footer.
A combined technical and commercial bid paginated explicitly with areaBreak into four pages: cover with a fill-in info table → table of contents → bid letter and past performance (line chart of contract value and acceptance rate for three years) → technical proposal and commercial quotation.
Issued by a government service window after accepting an enterprise data-asset registration: a four-column acceptance table, grey section headings, two-column checkbox confirmations, numbered instructions, plus a tear-off customer copy and dual signature area.
The file cover printed after completion documents of an infrastructure project are handed over to the archive room: a 3pt outer frame, fonds number and security level at the top corners, a three-level oversized title block in the middle, a two-column record table and a filing/checking footer.
SPC statistics of key dimensions across four production lines: the boxplot shows the minimum, Q1, median, Q3, maximum and outliers of each line, with sample-size and unit subtitles and stability conclusions plus first-article inspection advice below.
Daily January readings from 15 national monitoring stations: date on the X axis, AQI on the Y axis, bubble size for PM2.5 concentration and color for the air-quality grade, with values printed on the bubbles and pollution-event analysis below.
A 2024 day-by-day order-value calendar heatmap: each cell is one day and the light-to-dark purple scale maps low-to-high order value, making quarter-end spikes and holiday troughs easy to spot.
A grouped bar chart of East/North/South China and West region sales for October-December 2024, with value labels on the bars, a four-color legend at the bottom and monthly conclusions on regional leaders and growth.
Daily candlesticks of a stock for December 2024: red and green bodies show the day's rise or fall and the wicks show the high and low, with trading days on the axis plus notes on the early-month rally, mid-month pullback and moving-average support.
A quarterly GDP-growth line combined with eight development-index scatter points (innovation, coordination, green, openness, sharing and more) on one chart, highlighting the strong green score and the room to improve innovation.
A January-December dual-axis combo chart: bars for monthly delivered projects (left axis) and an orange line for the on-time delivery percentage (right axis), with every point labeled and both metrics trending upward.
A Gregorian-lunar monthly calendar: the Gregorian date sits above the lunar date in every cell, Labor Day, Mother's Day and the Grain Buds solar term are highlighted, weekends are shown in red, and holiday and term notes follow below.
A horizontal three-series bar chart for five product lines — budget, actual spend and deviation rate (×10) — with amount labels on the bars, making overspending lines obvious and supporting budget-review and baseline-adjustment advice.
A multi-line chart of 2024 monthly revenue for software, hardware and services, concluding that software stayed steady, hardware dipped on supply-chain pressure and services grew the fastest.
Two side-by-side radar charts comparing suppliers A and B across quality, price, delivery, service, technology and responsiveness, supporting the procurement strategy of prioritizing A for strategic goods while introducing B for competition on general goods.
A word cloud built from token statistics of 50,000 user reviews: top words such as stable, efficient and easy to use appear in very large tilted type while rare negative words scatter in small type, font size mapping directly to frequency.
A treemap splitting group revenue across core business, innovation business, support services and other segments: area maps revenue scale, same-hue sub-blocks are second-level business lines labeled with amounts, with conclusions on the core share and emerging growth.
31 general business and government documents: resumes, certificates, quotations, statements, acceptance sheets, contracts, lawyer letters, reports and receipts — pure layout templates covering multi-page flow, perforated seal strips and signature blocks.
31 demos
Single-column A4 resume: a dark-blue info banner plus self-evaluation and work, project and education sections, generated from a template with bound data.
One-page certificate with a centred title and a reserved seal area.
Quotation sheet with an itemised table, page numbers, an e-seal and bold amounts.
Customer statement: auto-paginated detail table, footer totals and page numbers.
Multi-page acceptance sheet with long-form notes and signature blocks for both parties.
Red-header onboarding notice on a single page.
Standard resignation certificate, ready to print on one page.
Multi-page approval archive: paginated flow records with repeated table headers and the approval number in the page header.
Weekly report with an SVG line/bar chart and automatic multi-page pagination.
Long contract draft with automatic pagination, numbered clauses and a seal area on the last page.
Delivery receipt whose table spans pages, with a sign-off row at the bottom.
A VAT invoice layout sample for demonstration only — not a real invoice.
Multi-page settlement book: perforated seal strip, project name in page headers and paginated detail tables.
Bank creditworthiness certificate with the bank seal at the bottom right.
Equipment inspection report form for maintenance records.
Product conformity certificate for medical devices.
Formal lawyer letter: letterhead, body clauses and a signature block.
The bid letter page of a tender document.
Winning-bid notice to be sealed and sent to the winning bidder.
Student transcript table with course grades.
Scholarship award certificate with a centred title and seal area.
Vehicle inspection report issued by a testing station.
Real-estate registration query result notice.
Confidentiality pledge with clause body and signature row.
Multi-page work-safety responsibility pledge with clauses, a seal strip and dual signatures.
Warehouse inbound sheet for goods receipt records.
Warehouse outbound sheet for goods issue records.
Appraisal summary with a cover page, agency seal and appraiser signature.
Health checkup report mixing text, an SVG trend chart, paginated item tables and the centre seal.
Multi-page power of attorney with a seal strip and signatures of both parties.
Supervision log: a cover plus one page per day with construction details and the supervisor's signature.
25 finance and tax bill samples: VAT special/general/fully-digitised invoices, customs payment notes, fiscal bills and expense claims — complete invoice elements for billing and reimbursement systems.
25 demos
VAT special invoice layout: invoice numbers, buyer/seller, itemised lines and tax-inclusive totals.
VAT general invoice layout in a crimson theme with header, detail table and seal placeholder.
Fully-digitised e-invoice layout with QR placeholder for paperless billing.
Motor vehicle sales invoice with VIN and other vehicle-specific fields.
Used-car sales invoice with vehicle transfer fields.
Toll e-invoice for ETC and highway toll scenarios.
Taxi / ride-hailing invoice with boarding time and mileage.
Railway ticket / air e-ticket itinerary for travel reimbursement.
Fixed-amount / general machine-printed invoice sample.
Customs import VAT payment note for import tax credit.
Customs duty payment note as proof of import duty.
Fiscal non-tax revenue bill for government charges.
Fiscal electronic payment receipt.
Internal cash receipt stub layout.
Payment request form with approval signature columns.
Expense claim form with detail lines and approval signatures.
Travel expense detail list with itinerary and receipt totals.
Invoice sales list / invoicing detail sheet.
Red-letter VAT invoice information table for reversal requests.
Red-letter VAT special invoice with negative amounts.
Refined-oil sales invoice with product specification columns.
Refined-oil outbound sheet as a depot issue voucher.
Fixed-asset purchase invoice sample.
Asset warehouse receipt for fixed-asset registration.
Invoice summary list for batch billing reconciliation.
15 foreign-trade and customs documents: customs declarations, bonded records, commercial invoices, packing lists, bills of lading, certificates of origin and letters of credit — bilingual layouts for cross-border scenarios.
15 demos
Customs import declaration with consignee, item numbers and duty columns.
Customs entry/exit bonded goods record list.
Customs declaration slip / on-site inspection receipt.
Bilingual COMMERCIAL INVOICE layout for trade settlement.
Bilingual PACKING LIST & MANIFEST layout.
Ocean bill of lading with shipper, consignee and notify party columns.
Dock receipt (DOCK RECEIPT) layout.
Certificate of origin (C/O & FORM A) layout.
Import/export commodity inspection and quarantine report.
Bonded goods record / cross-border e-commerce list.
Export tax refund declaration / refund receipt.
Foreign-exchange payment voucher / inward remittance slip.
Goods inspection notice / inspection result sheet.
Bonded warehouse in/out list / transit cargo list.
Letter of credit / issuance application for cross-border settlement.
15 banking documents: transfer receipts, account statements, cheques, acceptance bills, loan and guarantee vouchers, credit reports and AML screening lists.
15 demos
Transfer receipt / cash deposit slip: account info, transaction detail and bank seal placeholder.
Corporate bank account statement / transaction detail.
Cash / transfer cheque sample.
Banker's / trade acceptance bill sample.
Bill discount voucher / collection voucher.
Telegraphic / mail transfer voucher and payment order.
Loan debit note / loan contract receipt.
Loan release voucher / repayment completion receipt.
Wealth-management purchase confirmation / redemption receipt.
Guarantee issuance voucher / performance bond receipt.
Corporate credit query report, multi-page.
Audit working paper / confirmation receipt.
AML transaction screening list / suspicious transaction report.
Insurance policy / premium receipt / claim documents.
Factoring receivables list / receivables assignment voucher.
15 government documents: acceptance receipts, approval decisions, annual-review forms, project approval opinions, subsidy claims and document flow receipts.
15 demos
Government service acceptance receipt.
Administrative approval application / licence decision.
Licence annual review application / review receipt.
Business licence change / filing receipt.
Real-estate registration acceptance / title certificate receipt.
Project approval opinion / feasibility review comments.
Fiscal subsidy application / disbursement receipt.
Special fund acceptance sheet / performance review receipt.
Bid-winning notice / tender registration receipt.
Administrative penalty notice / fine payment receipt.
Enterprise qualification application / review receipt.
Joint reward & punishment list / credit repair acceptance.
Official document flow sign-off / completion receipt.
Environmental assessment filing receipt / safety acceptance.
Commercial whitepaper filing / expert review receipt.
10 medical documents: record home pages, charge invoices, expense details, insurance settlement, lab reports and discharge summaries.
10 demos
Outpatient record / inpatient record home page.
Outpatient / inpatient charge invoice in fiscal-bill style.
Medical expense detail / drug & consumable list.
Medical insurance settlement / cross-region settlement receipt.
Examination / laboratory test report sheet.
Discharge summary / disease diagnosis certificate.
Medical expense claim form / insurance claim worksheet.
Health checkup screening report / item list.
Outpatient triage slip / bed reservation receipt.
Prescription / pharmacy charge check sheet.
5 supply-chain documents: purchase orders, sales outbound statements, incoming inspection, supplier admission and payment confirmations.
5 demos
Purchase order / delivery note / inbound acceptance sheet.
Sales outbound statement / account statement / settlement sheet.
Incoming material inspection / finished-goods QC report.
Supplier admission documents / performance review list.
Presale housing payment receipt / balance settlement confirmation.
15 styles of the unified credit report template, switching chart types and colour schemes within the same report layout.
15 demos
Compares revenue and net profit for 2020–2023 with a classic blue bar chart.
Shows how credit metrics evolve year over year with dark green lines.
Shows the cumulative growth of credit exposure with an indigo area chart.
Shows the share of each credit grade as an orange pie chart.
Presents the overall picture of multi-dimensional credit scores as a purple radar chart.
Compares two entities across the same metric set with a rose double radar chart.
Shows the composition of guarantee types as a deep green donut chart.
Shows the step-by-step drop in approval pass rate as a deep orange funnel chart.
Shows the current level of the composite credit score on a graphite gauge.
Shows the intensity of metric-by-time intersections as a deep purple heatmap.
Shows the correlation coefficients between credit metrics as an indigo matrix.
Shows the two-level structure of industry and region as an amber sunburst chart.
Shows the relative size of each business segment as a blue grey treemap.
Shows customers across balance, yield and count dimensions as a light blue bubble chart.
Shows the key milestones of the credit business in chronological order on a sepia timeline.
The same global banking report in 25 languages (numbered 185-209): Arabic, Bengali, Simplified and Traditional Chinese, Dai (New Tai Lue), English, French, German, Hebrew, Indonesian, Japanese, Korean, Malay, Manchu, traditional Mongolian, Persian, Portuguese, Russian, Spanish, Tagalog, Tamil, Thai, Tibetan, Uyghur and Vietnamese. Each language ships as a standalone report with its own layout, colour scheme and chart theme; the previews are full-length screenshots covering every page. Multilingual rendering requires JQuick-Pdf 4.4.0 or later.
25 demos
A right-to-left layout with a deep-brown banner, amber-gold rules and fully right-to-left paragraphs.
Cinnabar red with a Ganges-green left block and rounded KPI cards; Bengali conjuncts and vowel signs stay intact.
A violet theme with rounded KPI cards and centred rounded section pills.
Vermilion with gilded double rules and a centred header in a formal Traditional Chinese layout.
Palm-leaf green and bamboo yellow, with section numbers set in New Tai Lue digits ᧑᧒᧓.
Graphite and signal orange, left-aligned, with frameless hairline tables.
Mist blue with italic section titles and horizontal hairlines only.
Steel grey with mustard accents, a full deep-line grid and right-aligned numbers.
Olive with heavy right rules and a fully right-to-left layout.
Indigo with gold hairline frames, a centred tinted section band and a tinted table head.
Indigo and vermilion with a top rule card and generous whitespace.
Dancheong blue with a five-direction colour bar and a fully ruled 2×4 KPI grid.
Tropical ochre and deep green with a double-framed header and a single-row 8-cell KPI strip.
An archive-envelope frame in ink blue and copper, with vertical Manchu script columns.
Steppe green with a gold pattern bar and airy sections in vertical Mongolian script.
Violet and turquoise with centred symmetrical ornaments and fully right-to-left text.
Ocean blue and gold with a tile-strip header, dashed KPI cells and numbered sections.
A crimson full-width banner with centred symmetry and double rules around the title.
Crimson with a heavy left bar, an oversized 21pt title and black KPI label rows.
Amber and deep-sea blue blocks with numbered badges for every section.
Rose and deep indigo with a three-tier bar and cross-grid KPI; Tamil vowel signs and ligatures render intact.
Gold leaf and rosewood with centred double rules and ๏ section marks.
A crimson banner with a gold script band; Tibetan stacked letters render correctly.
Emerald with copper rules, right-to-left tables and correct Arabic-script joining.
Celadon bands, right-aligned label columns and a full hairline table with complete Vietnamese tone marks.