
Export "After-Sales Complaint Quality Analysis" to Excel with Java (Styled & Formatted Reports)
Styled & Formatted ReportsScene 0088
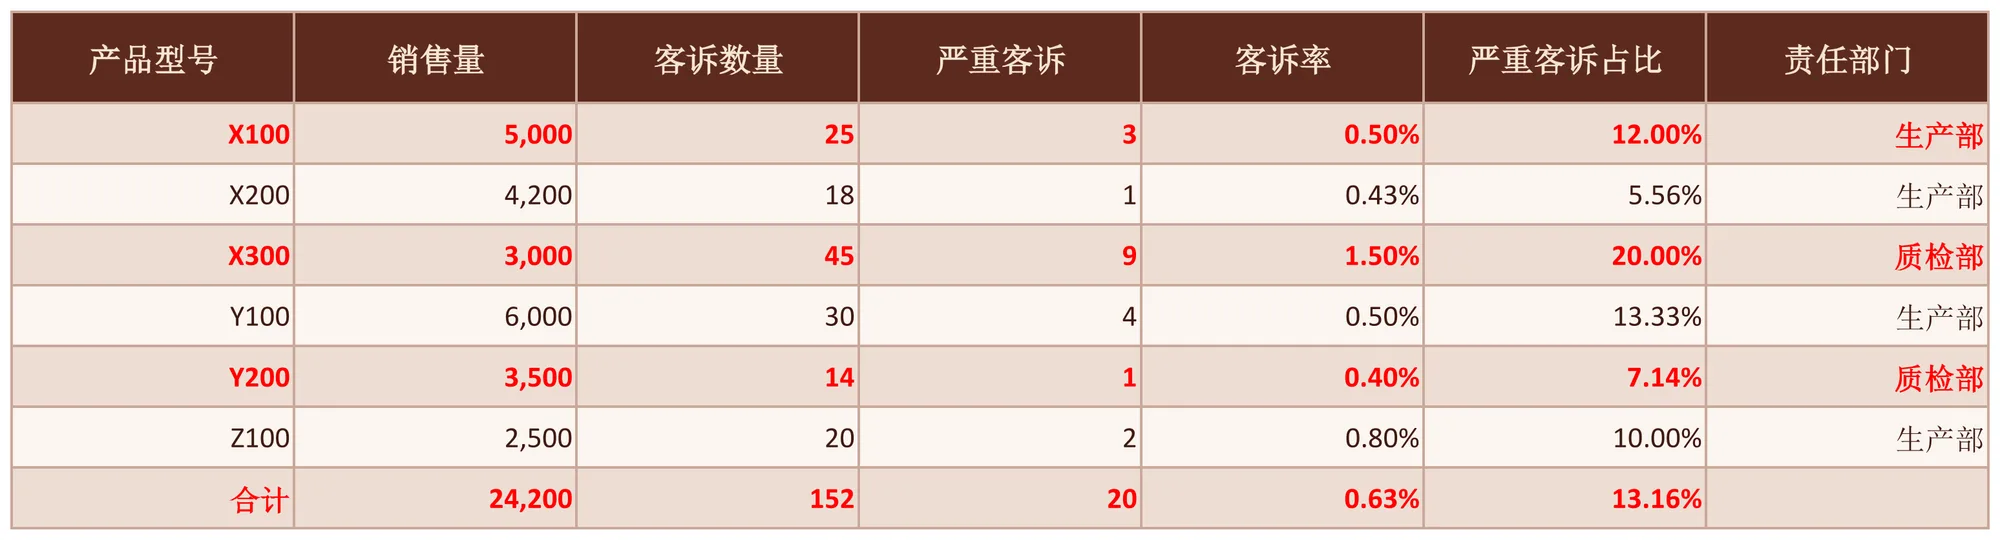
Registers sales volume and complaint count per product, computing Complaint Rate = Complaint Count / Sales Volume and Severe Complaint Share = Severe Complaints / Complaint Count, with the last row summarizing sales volume, complaint count, severe complaint count and the overall complaint rate; the product with the highest complaint rate is marked in red. Implemented declaratively in pure XML — no Java business code required.
About this demo
This demo exports the "After-Sales Complaint Quality Analysis" workbook: 1 data sheet(s); MAPPING over 7 columns (产品型号, 销售量, 客诉数量, 严重客诉, 客诉率, 严重客诉占比, 责任部门), 20 formula(s), 1 style rule(s). On the Java side it builds 7 data rows and calls exportAfterSalesComplaintAnalysis() once — everything else is driven by the config.
It belongs to the "Styled & Formatted Reports" group: STYLE and conditional formatting: themed headers, zebra striping, highlighted total rows and threshold-based colouring of abnormal cells.
What you can copy from this page
- The complete Java test class (66 lines, runnable as-is)
- The complete XML config (33 lines: mapping, formulas, styles, charts and every other rule)
- The exported xlsx file (real output, comparable with the preview above)
Related searches: Java export Excel styles, Java Excel header style zebra rows, Apache POI CellStyle export, Java Excel conditional formatting, export After-Sales Complaint Quality Analysis to Excel with Java
Output specs
- Scene no.
- 0088
- Group
- Styled & Formatted Reports
- Config lines
- 33
- Source lines
- 66
Java source · Style0088AfterSalesComplaintAnalysisDemo.java
This is the complete test class that produced the Excel file above — copy it and run as-is. Java only builds the data rows; all statistics and styling live in the XML config.
package com.github.paohaijiao.biz.style;

import com.github.paohaijiao.statement.JQuickRow;
import com.github.paohaijiao.xml.ex.JQuickExcelExportXmlParseFactory;
import com.github.paohaijiao.xml.factory.JQuickFactory;
import com.github.paohaijiao.xml.factory.JQuickXmlFactory;
import com.github.paohaijiao.xml.handler.JQuickParseHandler;
import org.junit.Test;

import java.io.File;
import java.io.FileOutputStream;
import java.io.OutputStream;
import java.util.ArrayList;
import java.util.List;

public class Style0088AfterSalesComplaintAnalysisDemo {

    private static final String XML = "jquick/biz/style/0088_style_after-sales-complaint-analysis.xml";

    /** 导出:纯 XML 完成逐行客诉率、严重占比、合计与最高客诉率标红。 */
    @Test
    public void exportAfterSalesComplaintAnalysis() throws Exception {
        List<JQuickRow> rows = new ArrayList<>();
        // e/f 留空,由 FORMULAS 计算
        rows.add(product("X100", 5000, 25, 3, "生产部"));
        rows.add(product("X200", 4200, 18, 1, "生产部"));
        rows.add(product("X300", 3000, 45, 9, "质检部"));
        rows.add(product("Y100", 6000, 30, 4, "生产部"));
        rows.add(product("Y200", 3500, 14, 1, "质检部"));
        rows.add(product("Z100", 2500, 20, 2, "生产部"));
        // 合计占位行:各列合计与整体客诉率留给 FORMULAS
        JQuickRow total = new JQuickRow();
        total.put("a", "合计");
        total.put("b", null);
        total.put("c", null);
        total.put("d", null);
        total.put("e", null);
        total.put("f", null);
        total.put("g", null);
        rows.add(total);

        File out = new File("D:/test/excel/biz/style/0088_style_after-sales-complaint-analysis.xlsx");
        try (OutputStream os = new FileOutputStream(out)) {
            JQuickParseHandler parser = new JQuickExcelExportXmlParseFactory("mahogany", rows, os);
            JQuickFactory factory = new JQuickXmlFactory(parser, XML);
            Style0088AfterSalesComplaintAnalysisService service = factory.createApi(Style0088AfterSalesComplaintAnalysisService.class);
            service.exportAfterSalesComplaintAnalysis("field", "value");
        }

    }

    /** 构造一个产品的客诉数据(a=型号,b=销售量,c=客诉数量,d=严重客诉,e/f 留空,g=责任部门)。 */
    private static JQuickRow product(String model, double salesQuantity, double complaintQuantity,
                                     double seriousComplaint, String responsibleDepartment) {
        JQuickRow row = new JQuickRow();
        row.put("a", model);
        row.put("b", salesQuantity);
        row.put("c", complaintQuantity);
        row.put("d", seriousComplaint);
        row.put("e", null);
        row.put("f", null);
        row.put("g", responsibleDepartment);
        return row;
    }
}
Minimal invocation (4 lines)
The core is these four lines: hand the rows to the parser, the parser to the factory, get a typed Service and call it. Copy them straight into your project.
// rows 由业务代码构造(List<JQuickRow>),os 为输出流,见下方完整源码
JQuickParseHandler parser = new JQuickExcelExportXmlParseFactory("mahogany", rows, os);
JQuickFactory factory = new JQuickXmlFactory(parser, XML);
Style0088AfterSalesComplaintAnalysisService service = factory.createApi(Style0088AfterSalesComplaintAnalysisService.class);
XML config · 0088_style_after-sales-complaint-analysis.xml
Formats (FORMAT), formulas (FORMULAS) and styles (STYLE) are all declared in this XML, fully decoupled from the Java code. The full config is below — copy it as-is.
<?xml version="1.0" encoding="UTF-8"?>
<!DOCTYPE excels PUBLIC "-//PAOHAIJIAO//DTD API EXCEL 1.0//EN"
        "classpath:paohaijiao/dtd/Jquick-excel.dtd">
<excels namespace="com.github.paohaijiao.biz.style.Style0088AfterSalesComplaintAnalysisService">

    <!-- 导出:售后客诉质量分析表 -->
    <excel name="exportAfterSalesComplaintAnalysis" returnClass="void">
        <![CDATA[
            EXPORT WITH SHEET="售后客诉质量分析表", HEADER=true,
                MAPPING={"a":"产品型号","b":"销售量","c":"客诉数量","d":"严重客诉","e":"客诉率","f":"严重客诉占比","g":"责任部门"},
                FORMAT={"b":"#,##0","c":"#,##0","d":"#,##0","e":"0.00%","f":"0.00%"},
                FORMULAS={
                    E2:'C2/B2',F2:'D2/C2',E3:'C3/B3',F3:'D3/C3',E4:'C4/B4',F4:'D4/C4',
                    E5:'C5/B5',F5:'D5/C5',E6:'C6/B6',F6:'D6/C6',E7:'C7/B7',F7:'D7/C7',
                    B8:'SUM(B2:B7)',C8:'SUM(C2:C7)',D8:'SUM(D2:D7)',E8:'C8/B8',F8:'D8/C8'
                },
                STYLE={
                    ROW 8:{bold:true,fillPattern:solid_foreground,fillForegroundColor:lightYellow,alignment:right,verticalAlignment:center},
                    E4:{color:red,bold:true}
                }
        ]]>
    </excel>

    <!-- 导入解析:读取导出的售后客诉质量分析表 -->
    <excel name="importAfterSalesComplaintAnalysis" returnClass="java.util.List">
        <![CDATA[
            IMPORT WITH SHEET="售后客诉质量分析表", HEADER=true,
                MAPPING={"产品型号":"productModel","销售量":"salesQuantity","客诉数量":"complaintQuantity","严重客诉":"seriousComplaint","客诉率":"complaintRate","严重客诉占比":"seriousRatio","责任部门":"responsibleDepartment"}
        ]]>
    </excel>

</excels>
More demos in this group
The Excel file, preview image, XML config and source code on this page were all produced by a real JQuick-Excel run and are free to copy into your own project.