
Export "Advertising ROI Analysis" to Excel with Java (Chart & Visualization)
Chart & VisualizationScene 0108
Advertising spend and sales for each store, computing the return ratio (Sales / Advertising Spend) at each row's end and summarizing in the last row; includes a scatter chart showing the relationship between spend and output. All statistics and charts are declared in XML. Exported as a multi-sheet workbook (Advertising ROI Analysis / Advertising ROI Scatter Chart). Implemented declaratively in pure XML — no Java business code required.
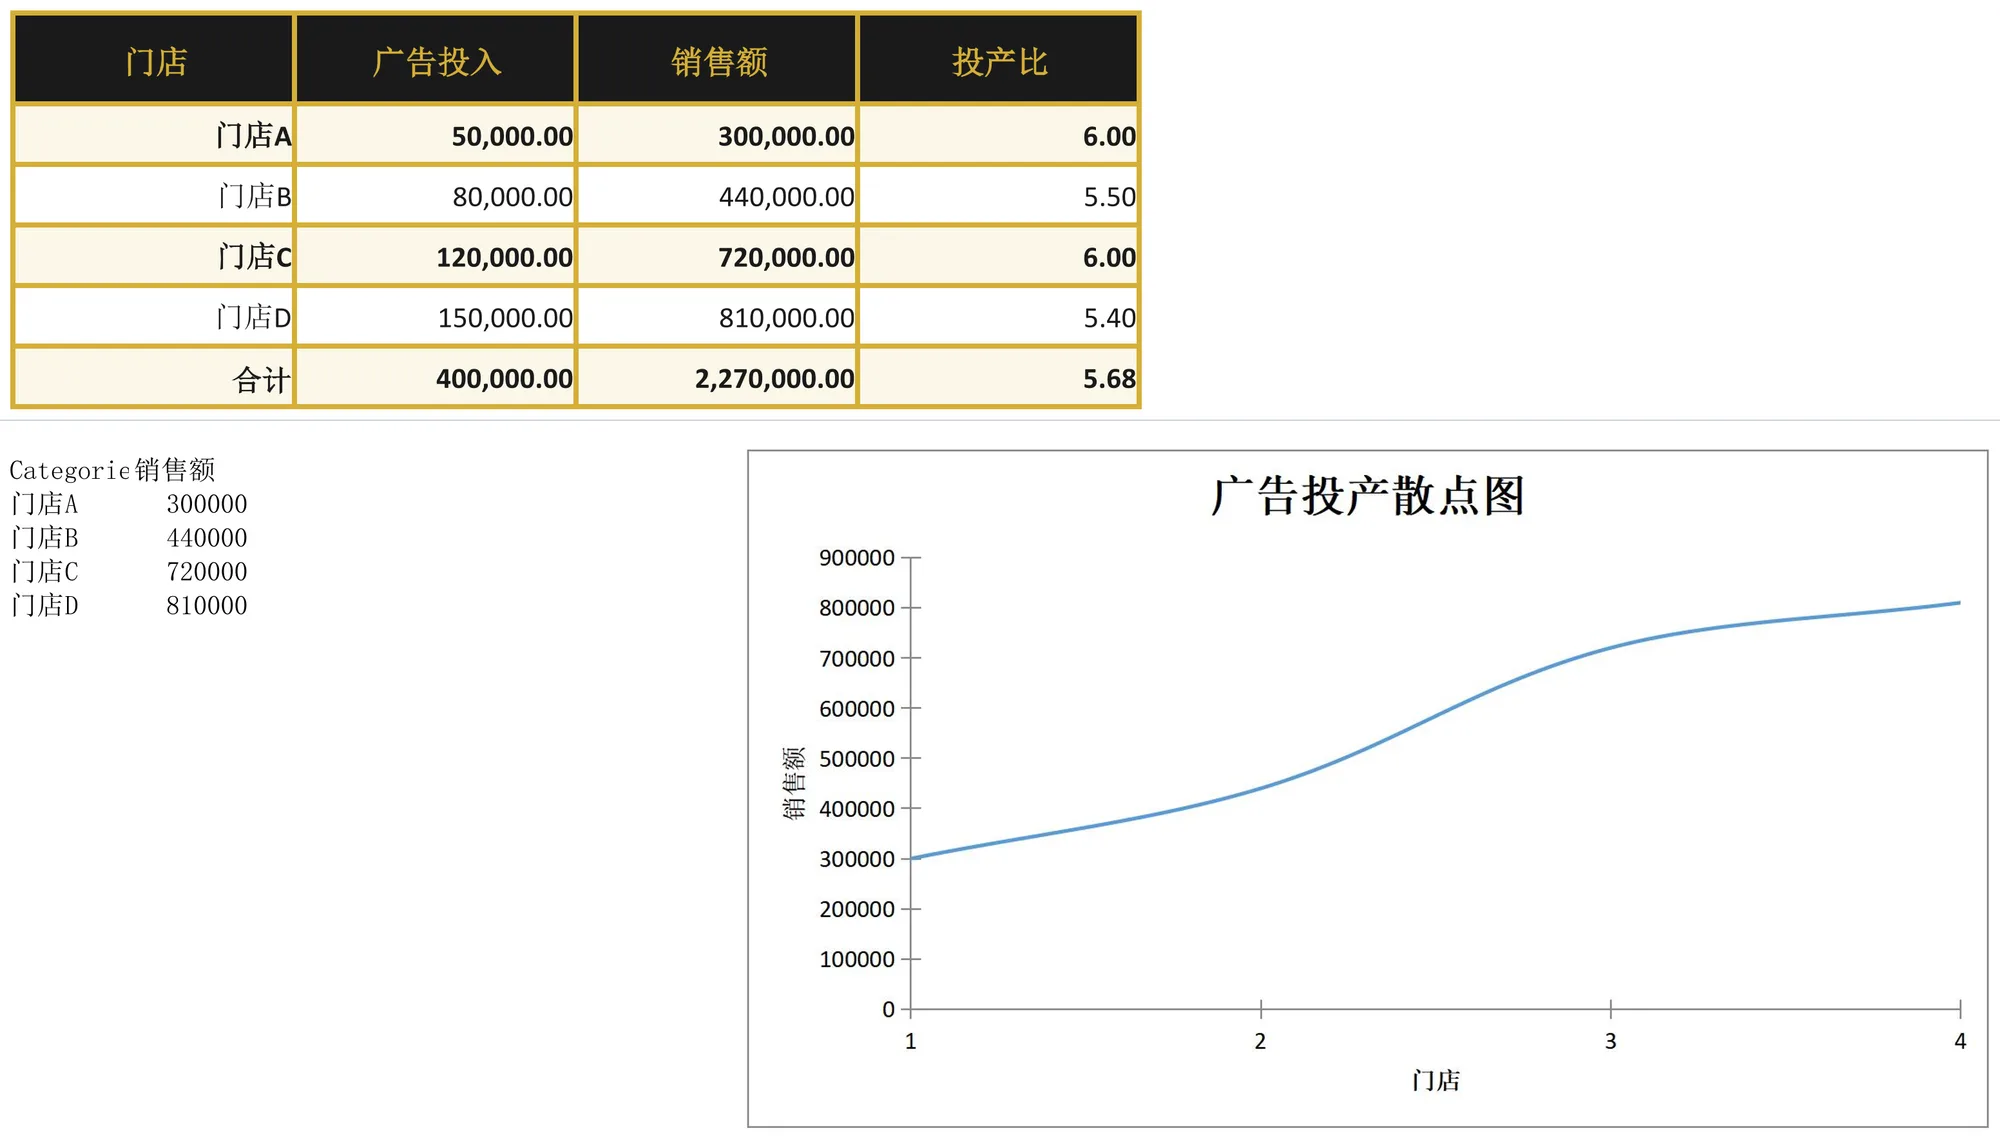
About this demo
This demo exports the "Advertising ROI Analysis" workbook: 1 data sheet(s); MAPPING over 4 columns (门店, 广告投入, 销售额, 投产比), 9 formula(s), 1 style rule(s), SCATTER chart on its own sheet. On the Java side it builds 5 data rows and calls exportAdSpendSales() once — everything else is driven by the config.
It belongs to the "Chart & Visualization" group: GRAPH charts — column, line, scatter and radar charts written into a separate sheet, making the workbook multi-sheet.
What you can copy from this page
- The complete Java test class (60 lines, runnable as-is)
- The complete XML config (34 lines: mapping, formulas, styles, charts and every other rule)
- The exported xlsx file (real output, comparable with the preview above)
Related searches: Java export Excel chart, Java generate Excel line chart, Apache POI chart export example, Java multi-sheet workbook export, export Advertising ROI Analysis to Excel with Java
Output specs
- Scene no.
- 0108
- Group
- Chart & Visualization
- Config lines
- 34
- Source lines
- 60
Java source · Graph0108AdSpendSalesDemo.java
This is the complete test class that produced the Excel file above — copy it and run as-is. Java only builds the data rows; all statistics and styling live in the XML config.
package com.github.paohaijiao.biz.graph;

import com.github.paohaijiao.statement.JQuickRow;
import com.github.paohaijiao.xml.ex.JQuickExcelExportXmlParseFactory;
import com.github.paohaijiao.xml.factory.JQuickFactory;
import com.github.paohaijiao.xml.factory.JQuickXmlFactory;
import com.github.paohaijiao.xml.handler.JQuickParseHandler;
import org.junit.Test;

import java.io.File;
import java.io.FileOutputStream;
import java.io.OutputStream;
import java.util.ArrayList;
import java.util.List;

public class Graph0108AdSpendSalesDemo {

    private static final String XML = "jquick/biz/graph/0108_graph_ad-spend-sales.xml";

    /** 导出:4 个门店 + 1 行合计 + 散点图,回读校验投产比、汇总与图表 sheet。 */
    @Test
    public void exportAdSpendSales() throws Exception {
        List<JQuickRow> rows = new ArrayList<>();
        rows.add(detail("门店A", 50000, 300000));
        rows.add(detail("门店B", 80000, 440000));
        rows.add(detail("门店C", 120000, 720000));
        rows.add(detail("门店D", 150000, 810000));
        rows.add(totalRow());

        File out = new File("D:/test/excel/biz/graph/0108_graph_ad-spend-sales.xlsx");
        try (OutputStream os = new FileOutputStream(out)) {
            JQuickParseHandler parser = new JQuickExcelExportXmlParseFactory("royalGold", rows, os);
            JQuickFactory factory = new JQuickXmlFactory(parser, XML);
            Graph0108AdSpendSalesService service = factory.createApi(Graph0108AdSpendSalesService.class);
            service.exportAdSpendSales("field", "value");
        }

    }

    /** 构造一条门店明细(d=投产比由 FORMULAS 计算,占位保列)。 */
    private static JQuickRow detail(String store, double adSpend, double sales) {
        JQuickRow row = new JQuickRow();
        row.put("a", store);
        row.put("b", adSpend);
        row.put("c", sales);
        row.put("d", null);
        return row;
    }

    /** 合计行:只写「合计」文字,其余列以空值占位(必须补齐全部映射列)。 */
    private static JQuickRow totalRow() {
        JQuickRow row = new JQuickRow();
        row.put("a", "合计");
        row.put("b", null);
        row.put("c", null);
        row.put("d", null);
        return row;
    }
}
Minimal invocation (4 lines)
The core is these four lines: hand the rows to the parser, the parser to the factory, get a typed Service and call it. Copy them straight into your project.
// rows 由业务代码构造(List<JQuickRow>),os 为输出流,见下方完整源码
JQuickParseHandler parser = new JQuickExcelExportXmlParseFactory("royalGold", rows, os);
JQuickFactory factory = new JQuickXmlFactory(parser, XML);
Graph0108AdSpendSalesService service = factory.createApi(Graph0108AdSpendSalesService.class);
XML config · 0108_graph_ad-spend-sales.xml
Formats (FORMAT), formulas (FORMULAS) and styles (STYLE) are all declared in this XML, fully decoupled from the Java code. The full config is below — copy it as-is.
<?xml version="1.0" encoding="UTF-8"?>
<!DOCTYPE excels PUBLIC "-//PAOHAIJIAO//DTD API EXCEL 1.0//EN"
        "classpath:paohaijiao/dtd/Jquick-excel.dtd">
<excels namespace="com.github.paohaijiao.biz.graph.Graph0108AdSpendSalesService">

    <!-- 导出:广告投产分析 -->
    <excel name="exportAdSpendSales" returnClass="void">
        <![CDATA[
            EXPORT WITH SHEET="广告投产分析", HEADER=true,
                MAPPING={"a":"门店","b":"广告投入","c":"销售额","d":"投产比"},
                FORMAT={"b":"#,##0.00","c":"#,##0.00","d":"0.00"},
                FORMULAS={
                    D2:'C2/B2',D3:'C3/B3',D4:'C4/B4',D5:'C5/B5',
                    B6:'SUM(B2:B5)',C6:'SUM(C2:C5)',D6:'C6/B6'
                },
                STYLE={ROW 6:{bold:true,fillPattern:solid_foreground,fillForegroundColor:lightYellow,alignment:right,verticalAlignment:center}},
                GRAPH={TYPE=SCATTER, TITLE="广告投产散点图", CATEGORY_AXIS=门店, VALUE_AXIS=销售额,
                       CATEGORIES=["门店A","门店B","门店C","门店D"],
                       SERIES=[
                           {NAME=销售额, DATA=[300000,440000,720000,810000]}
                       ]}
        ]]>
    </excel>

    <!-- 导入解析:读取导出的广告投产分析 -->
    <excel name="importAdSpendSales" returnClass="java.util.List">
        <![CDATA[
            IMPORT WITH SHEET="广告投产分析", HEADER=true,
                MAPPING={"门店":"store","广告投入":"adSpend","销售额":"sales","投产比":"roi"}
        ]]>
    </excel>

</excels>
More demos in this group
The Excel file, preview image, XML config and source code on this page were all produced by a real JQuick-Excel run and are free to copy into your own project.